
















Bitcoin and Ethereum coins. Source: TechGaged / Shutterstock.
The ETH/BTC Ratio Has Printed A Golden Cross For The First Time In 14 Months

Ethereum has been quietly outperforming Bitcoin since early June. Now the chart is catching up to that story. The ETH/BTC ratio just printed a golden cross, its first since July 2025, and the signal arrives after a 25% move off the June low.
What The Signal Actually Means
A golden cross forms when an asset’s 50-day moving average crosses above its 200-day moving average. It reflects a short-term trend that has strengthened enough to overtake the longer-term trajectory.
The ETH/BTC ratio bottomed at roughly 0.02100 in early June, the lowest since May 2020, and has since climbed back to 0.03126 as of 10:01 UTC on August 25, 2026.
Latest Stories
U.S. Treasuries Go On-Chain as Franklin Templeton Expands Into Asia

Solana Validators Are Voting to Slow New SOL Creation and Raise Daily Burns

More Than Half Of BlackRock’s Recent Bitcoin Buying Came In One Week
A Signal With A Mixed Track Record
The history here is worth sitting with. The February 2021 golden cross on ETH/BTC preceded a 93% rally that pushed the ratio to 0.0824 by mid-May that year.
The July 2025 cross delivered a 36% gain over four weeks before reversing sharply into the steeper decline that ultimately put ETH/BTC at its multi-year low.
The crosses that appeared in May and August 2022 both failed almost immediately, trapping bulls on the wrong side. That’s roughly a 50-50 record across the four most recent signals.
The current cross lands after Ethereum has already climbed 30% against Bitcoin since June 6, which means a meaningful portion of the move has already happened before the signal confirmed it.
What The Downturn Looked Like Up Close
This golden cross follows one of the most painful stretches ETH has had relative to Bitcoin in years.
Techgaged reported in May that the ETH/BTC ratio had fallen to its weakest level in roughly 10 months as Ethereum dropped toward $2,100 and synchronized selling pressure hit both assets on Binance.
That same stretch saw Ethereum’s taker sell volume surge above $1.1 billion as ETH tested support near $2,100.
Techgaged also noted earlier in the year that institutional accumulation at the supply level was quietly accelerating, with Bitmine adding 65,341 ETH in a single week and pushing its total holdings to 4.66 million tokens.
What The Weekly Chart Shows
As of 10:01 UTC on August 25, 2026, ETH/BTC trades at 0.03126 on the weekly chart, down 0.57% intraday. The 50-day moving average has crossed above the 200-day, confirming the golden cross.
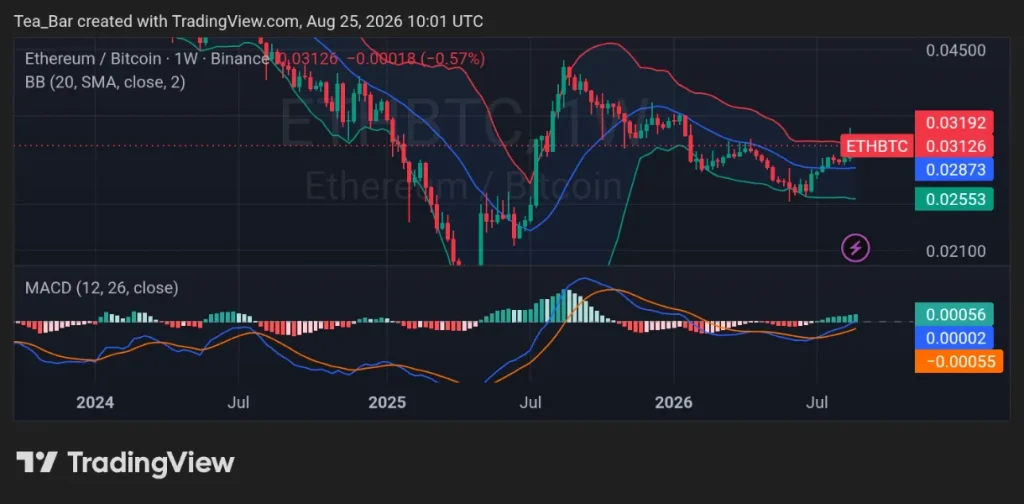
Price sits between the middle and upper Bollinger Bands, still with room to run before reaching the upper band near 0.03192. The weekly MACD histogram has turned green for the first time since early 2025.
Watch whether ETH/BTC can hold above the 0.03000 level over the next two weekly closes. A sustained hold above that zone would suggest this cross is tracking the 2021 playbook rather than the 2022 one.
Disclaimer:
This article is for informational purposes only and does not constitute financial, investment, or trading advice. The views expressed are based on publicly available data, market observations, and the author’s interpretation at the time of writing. Cryptocurrency markets are highly volatile and unpredictable, and past performance or current technical setups do not guarantee future results. Readers should conduct their own research and consult with a qualified financial advisor before making any investment decisions. TechGaged does not accept liability for any losses incurred based on the information presented.
How do you rate this article?
Subscribe to our YouTube channel for crypto market insights and educational videos.






Join our Socials
Briefly, clearly and without noise – get the most important crypto news and market insights first.
Most Read Today
1
What Is a Funding Rate in Crypto Trading?
2Fed Rate Hike Probability Climbs to 42% — What It Means for Markets
3Tokenized Assets Hit New Highs — US Treasuries Dominate the Growth
4Bitcoin Dominance Holds at 59% as Capital Concentrates Rather Than Rotating Into Altcoins
5Impermanent Loss Explained: Risks, Math, and Fixes
Latest





8
Also read
Similar stories you might like.

Crypto News
More Than Half Of BlackRock’s Recent Bitcoin Buying Came In One Week
Azeez | 2026-08-25

Crypto News
Bitcoin Dominance Holds at 59% as Capital Concentrates Rather Than Rotating Into Altcoins
Azeez | 2026-08-24

Crypto News
XRP Is Up 51% This Week — Its Biggest Weekly Gain in 21 Months
Azeez | 2026-08-24

Crypto News
Institutional Crypto Demand Is Surging As ETF Inflows Hit Multi-Month Highs
Azeez | 2026-08-23

Crypto News
Crypto Sentiment Flips — Another Major Market Shift May Be Underway
Azeez | 2026-08-22

Crypto News
Ethereum Was At Peak Fear Just Before The Market Turned
Azeez | 2026-08-21

Crypto News
One Bitcoin Trend Is Beginning To Look Strikingly Familiar
Azeez | 2026-08-21

Crypto News
Ethereum’s Largest Client Moves To Chainlink — Investors Are Watching
Azeez | 2026-08-21

Crypto News
BlackRock Clients Are Loading Up On Ethereum — Is Something Big Coming?
Azeez | 2026-08-20

Crypto News
Over $300M In Bitcoin Shorts Liquidated As BTC Breaks Higher — What’s Next?
Azeez | 2026-08-19