


Stellar Reaches $3 Billion In Tokenized Real-World Assets. Source: TechGaged / Shutterstock
Stellar Reaches $3 Billion in Tokenized Real-World Assets
In Brief
- • Stellar's tokenized RWA market has surpassed $3 billion, reaching the milestone in just six months.
- • The network crossed $1 billion in January, $2 billion in April, and $3 billion in June 2026.
- • Franklin Templeton, Ondo, and Realiz are among the largest issuers, while US Treasuries remain the dominant asset class.

The total market cap of tokenized real-world assets (RWAs) on the Stellar network has moved above $3 billion.
The team behind the network has announced this milestone, adding that it quickly surpassed the first $2 billion since the beginning of 2026.
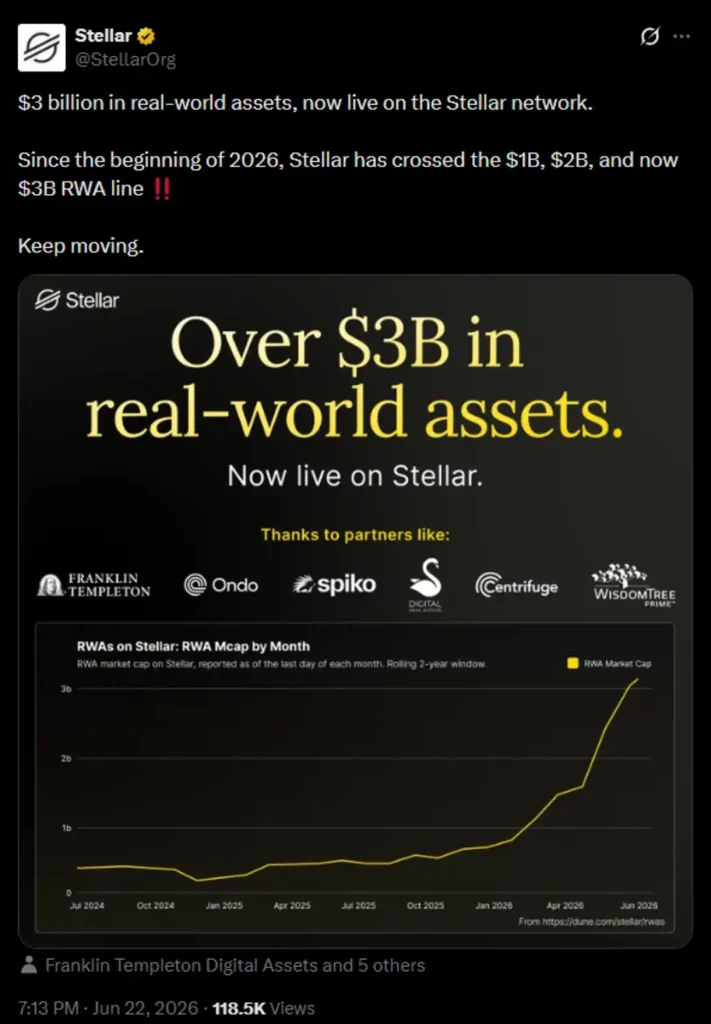
3 milestones in 6 months
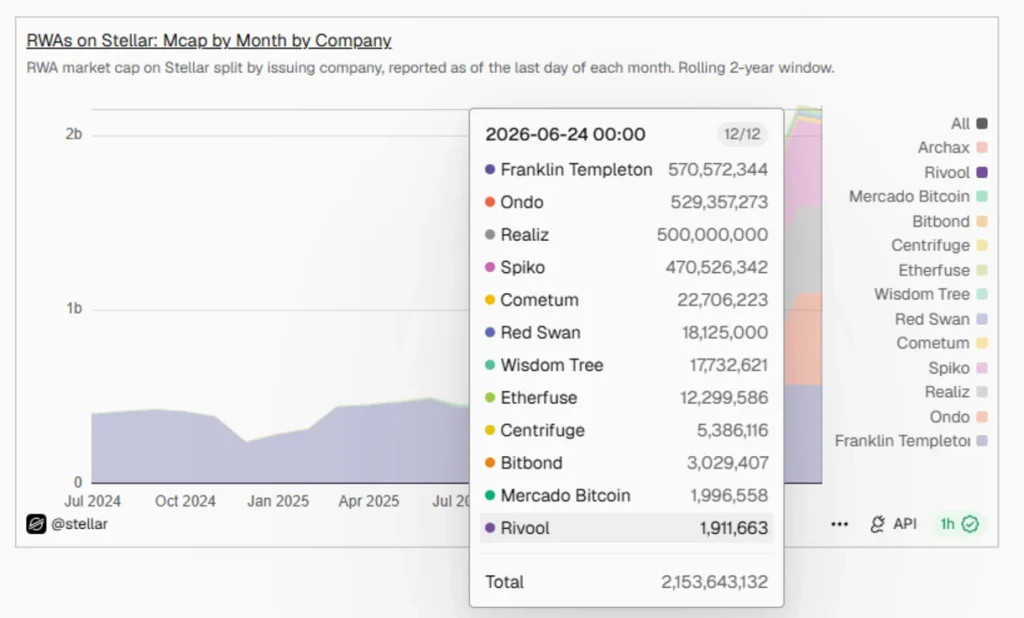
At the time of writing on Friday evening (UTC), the RWA market cap on Stellar stands at $3,020,391,467.
Latest Stories
Down $1.7B, SharpLink Resumes Buying Ethereum

Bitcoin Dips Below $59K as ETFs Let Go of $696 Million and Options Expire

Aave Fires Back at Kraken Report, Denies Selling Tokens at a 70% Discount
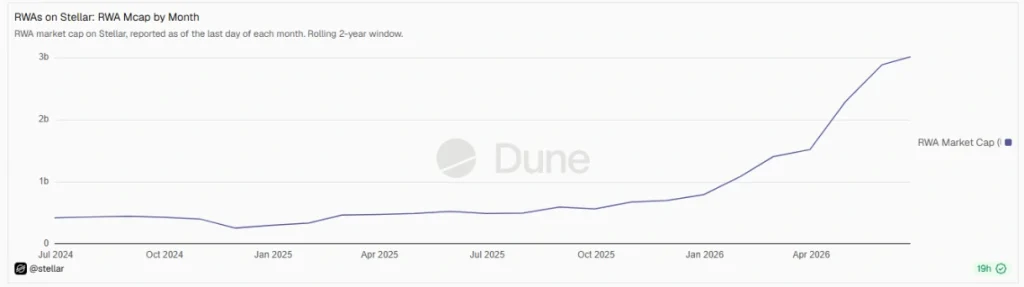
The chart shows that this number stood below half a billion USD between July 2024 and July 2025, when it finally surpassed this first milestone. It closed 2025 at $796 million.
The market cap surged at this point. By the end of January 2026, RWAs on Stellar rose above $1 billion, followed by $2 billion in April, and finally $3 billion in June. It’s currently still rising.
Franklin Templeton leads the list
Looking at issuing companies, we find Franklin Templeton at the top with nearly $571 million. Its BENJI token represents shares of its OnChain US Government Money Fund.
It’s followed by Ondo’s $530 million and Realiz’s $500 million.
As for asset subclass, US Treasuries lead with $1.23 billion, with active strategies in second place with $524.5 million. Public credit, non-US government debt, and real estate follow with $500 million, $493.5 million, and $165.8 million, respectively.
The rest of the asset subclasses on the list sit below $50 million each.
Meanwhile, the XLM coin currently sits in the 16th spot per market cap, totalling over $6 billion at the time of writing.
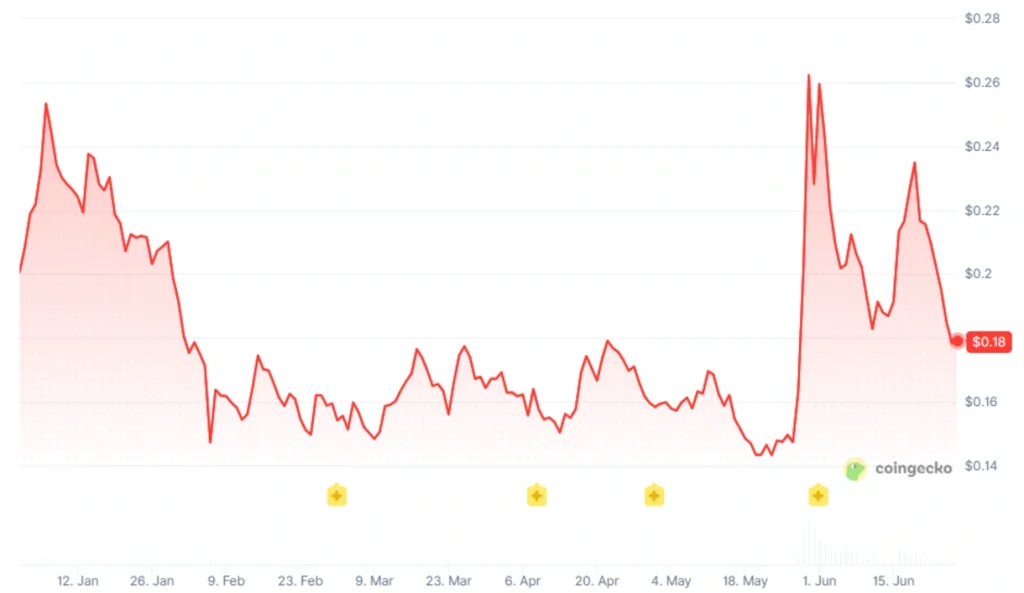
Having appreciated 1.8% in a day, it’s trading at $0.1785. Over the past day, it moved between the intraday low of $0.1715 and the intraday high of $0.1797.
That said, XLM is down 18% in a week, up 7.7% in a month, down 25% in a year, and down just below 80% from its all-time high of $0.8756 recorded in January 2018.
How do you rate this article?
Subscribe to our YouTube channel for crypto market insights and educational videos.


Join our Socials
Briefly, clearly and without noise – get the most important crypto news and market insights first.
Most Read Today
1
The Disconnect: $ZEC Prices Rebound While Social Sentiment Dries Up
2Ripple Wins Japan Approval For $1.7B RLUSD
3Bitcoin Reaches 20-Month Low, Rebounds From Sub-$60K Dip, Altcoins Stay Largely Red
4SBI Launches Japan’s First Trust-Type Yen Stablecoin
5Bitcoin’s Next Move May Not Depend on Tech Stocks Anymore
Latest


8
Also read
Similar stories you might like.
Crypto News
Ethereum’s Hidden Strength Just Showed Up in the Data
Azeez | 2026-06-26

Crypto News
SBI Launches Japan’s First Trust-Type Yen Stablecoin
Rokas | 2026-06-25
Crypto News
Solana’s Latest Milestone Goes Beyond Price Action
Azeez | 2026-06-25

Crypto News
WSJ: Iran-Linked Entities Moved $3.84B Through CoinEx, Exchange Responds
Ana | 2026-06-25

Altcoins
Ethereum Foundation Announces Major Shake-Up and Budget Cuts
Ana | 2026-06-24
Altcoins
MoneyGram Becomes Solana Validator, Expands Blockchain Payments Push
Ana | 2026-06-23
Altcoins
Ripple Nears Full EU Crypto Approval Under MiCA
Rokas | 2026-06-23
Blockchain
WSJ Investigation Questions Polymarket’s Viral Success
Rokas | 2026-06-23

Crypto News
The Metric That Could Signal Avalanche’s Next Move
Azeez | 2026-06-22

Crypto News
Solana Wins Landmark Korean Banking Deal
Rokas | 2026-06-22