


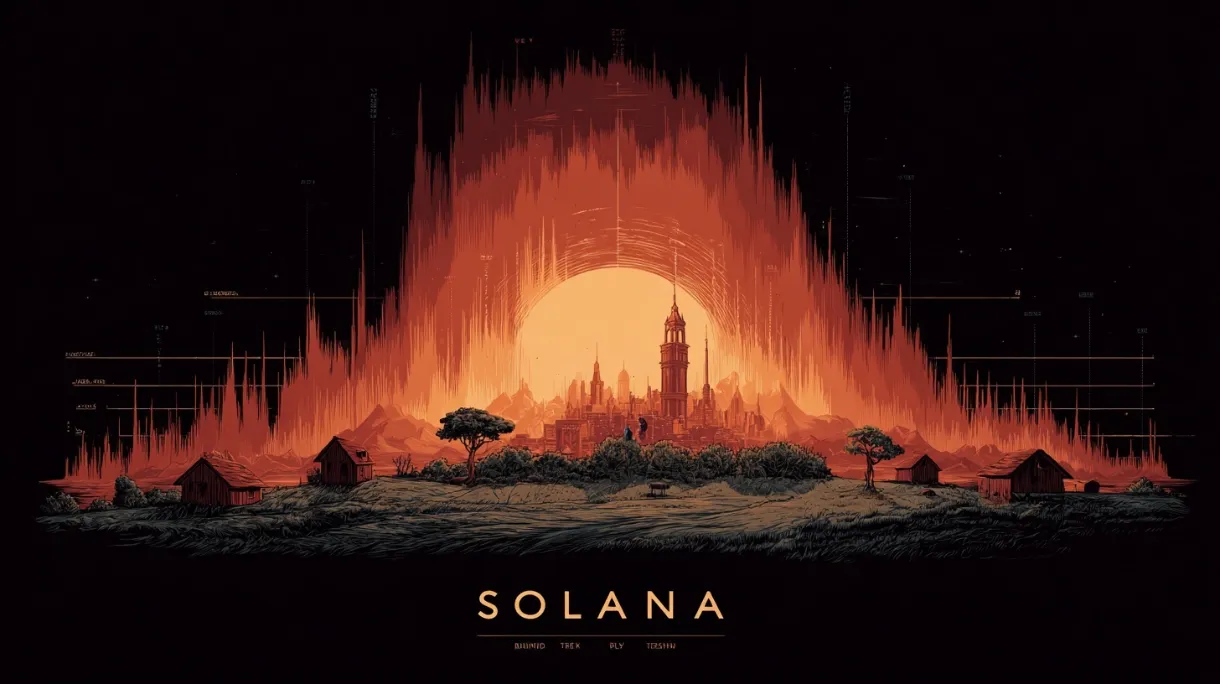
Solana Might Be Done Bleeding - Charts Say Buy
Solana Might Be Done Bleeding – Charts Say “Buy”
In Brief
- • Solana’s weekly chart just flashed a new TD Sequential buy signal.
- • The indicator has reliably marked major SOL reversals since 2023.
- • The signal appears as SOL holds key support after a sharp correction.
Ad
For nearly two years, the TD Sequential indicator has been unusually reliable at pinpointing major trend shifts on Solana. Now it’s back and flashing a fresh weekly buy signal just as SOL sits at the tail end of an aggressive correction.
Indeed, the timing is very hard to ignore, as since March 2023, previous TD-Sequential ‘9’ candles on Solana’s weekly chart have aligned with clear inflection points: local tops, capitulation lows, and early-stage reversals.
As it happens, the latest signal arrives after a multi-week decline that erased a substantial portion of Solana’s late-year gains, pushing price back toward a key support region, according to the analysis shared by renowned cryptocurrency trading expert Ali Martinez in an X post on December 2.
Pattern Solana Traders Have Learned Not to Dismiss
Each of the last major TD signals preceded a recognizable shift in behavior. When the indicator printed a “9” at the top, SOL corrected sharply. When it appeared at the bottom, Solana began multi-week recoveries, including one rally of more than 90 percent.
While no indicator is perfect, this one has earned a degree of attention within the Solana trading community.
This week’s signal arrives at a moment when sentiment is shaken but not broken. Solana continues to hold a structurally important support band, and the TD Sequential suggests selling pressure may be reaching exhaustion. If the pattern repeats, SOL could be approaching the point where markets begin to favor buyers again.
Currently, its price stands at $135.91, which indicates an increase of 8.8% in the last 24 hours, a 1.53% gain across the previous seven days, and a loss of 26.44% accumulated on its monthly chart, according to the most recent information.

The next few candles will confirm whether this turns into a broader reversal or simply a temporary pause. But given the indicator’s track record since 2023, traders are watching this setup closely.
More Must-Reads:
How do you rate this article?
Subscribe to our YouTube channel for crypto market insights and educational videos.


Join our Socials
Briefly, clearly and without noise – get the most important crypto news and market insights first.

Most Read Today
1
Chainlink’s 499% Social Volume Spike: Why Attention is Outpacing Price
2Cardano (ADA) Price Analysis: Quiet Accumulation as Technical Signals Begin to Strengthen
3Mantle’s $1B Milestone: Why MNT is the Next Layer 2 Powerhouse to Watch
4Digital Silver’s Silent Strength: Litecoin (LTC) Fundamental and Technical Dive
5Zcash: The VC-Backed Rebirth of Private Finance
Latest


8
Also read
Similar stories you might like.

Altcoins
Chainlink’s 499% Social Volume Spike: Why Attention is Outpacing Price
Azeez | 2026-03-15

Altcoins
The Institutional Push: Why the Aptos & Mastercard Alliance is a High-Stakes Bet for 2026
Azeez | 2026-03-14
Altcoins
The Institutional Green Light: Analyzing AVAX as Grayscale’s Staking ETF Hits Nasdaq
Azeez | 2026-03-14

Altcoins
The Pi Day Pivot: Can Polkadot’s Massive Supply Cut Fuel a DOT Breakout?
Azeez | 2026-03-14

Altcoins
Ethereum Foundation Drops New Manifesto For The Network; What’s New?
Ana | 2026-03-13

Altcoins
XRP Triangle Pattern Points To Major Upside Target
Ana | 2026-03-13

Altcoins
Whales Quietly Scoop Up Millions Of TRUMP Tokens; What’s Happening?
Rokas | 2026-03-13

Bitcoin
Supply Shock: 204K BTC Leave Exchanges As Whales Stay Dormant
Rokas | 2026-03-13

Bitcoin
Record Strategy Bitcoin Purchase Raises Supply Pressure Questions
Rokas | 2026-03-13

Bitcoin
Should You Sell Bitcoin at $100K? Here’s What ChatGPT Says
Rokas | 2026-03-12