


Bitcoin token on golden background. Source: TechGaged / Shutterstock
Bitcoin Pulls Back to $78K–$79K — Oversold Bounce Loading or Deeper Correction?
In Brief
- • Bitcoin fell below $80K after strong inflation data.
- • ETFs saw $1B in weekly outflows.
- • $78K support now decides the next move.

Bitcoin is back below $80,000 — and the reason matters more than the number. Bitcoin slipped to $79,049 on Saturday after exhibiting strong bullish momentum earlier in the week.
Market analysts attribute the dip to the latest U.S. producer price inflation data — accelerating to 6.
This sparked renewed concerns about the Federal Reserve’s rate trajectory and prompted brief profit-taking across risk assets.
U.S. spot Bitcoin ETFs recorded their largest weekly outflow in months — a net $1 billion for the week ending May 15.
That reversed a six-week inflow streak. On the final trading day alone, all 11 ETFs logged $290.42 million in net outflows. Not a single fund posted a positive flow.
What Triggered the Pullback?
The 6% producer price inflation reading arrived faster than markets anticipated. It raises the probability that the Fed — now led by incoming chair Kevin Warsh — delays rate cuts further.
Tighter-for-longer monetary policy is not a friend to risk assets. Some participants point to profit-taking after the strong April run.
Others cite macro headwinds including the inflation print and upcoming Federal Reserve commentary.
Ethereum ETFs also saw $255.11 million in outflows this week — adding to a sense of sector-wide caution.
The ETF reversal is worth watching carefully. The $1 billion weekly exit is the largest since late January.
It echoes earlier dips seen in March and February 2026, when weekly red figures also topped several hundred million dollars before inflows resumed. History says this is not unusual. It does not make it comfortable.
What the Charts Are Telling Us
BTCUSD (Weekly): As of May 16, 2026 (17:40 UTC), Bitcoin trades at $78,251.63, down -1.02% on the week. The MACD histogram at +2,200.18 is positive and still growing — the bullish momentum from the April recovery has not reversed.
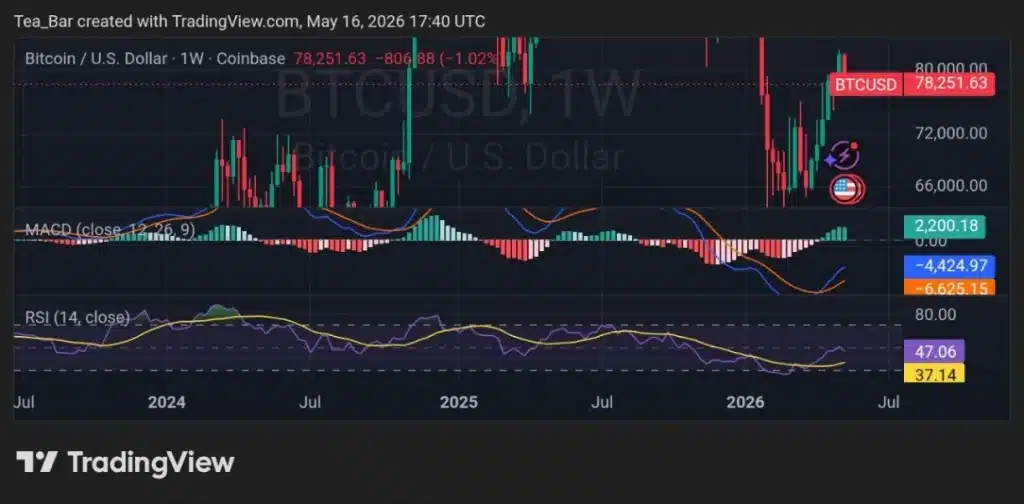
But the MACD line at -4,424.97 and signal at -6,625.15 remain in negative territory. The lines are converging but the crossover is not complete.
The RSI at 47.06 is mid-range. The RSI signal at 37.14 is rising from historically depressed levels. That divergence — RSI climbing while price pulls back — is worth monitoring.
It has preceded recoveries in prior cycles. The red dashed horizontal near $78,000 is the critical weekly support level. It held through the February capitulation. It is being tested again now.
BTCUSD (Daily): Bitcoin trades at $78,242.43, down -1.03% on the day. The Parabolic SAR at $82,488.93 sits above price — a bearish flip on the daily timeframe.
That is the most important technical development on this chart. The daily trend has technically reversed.
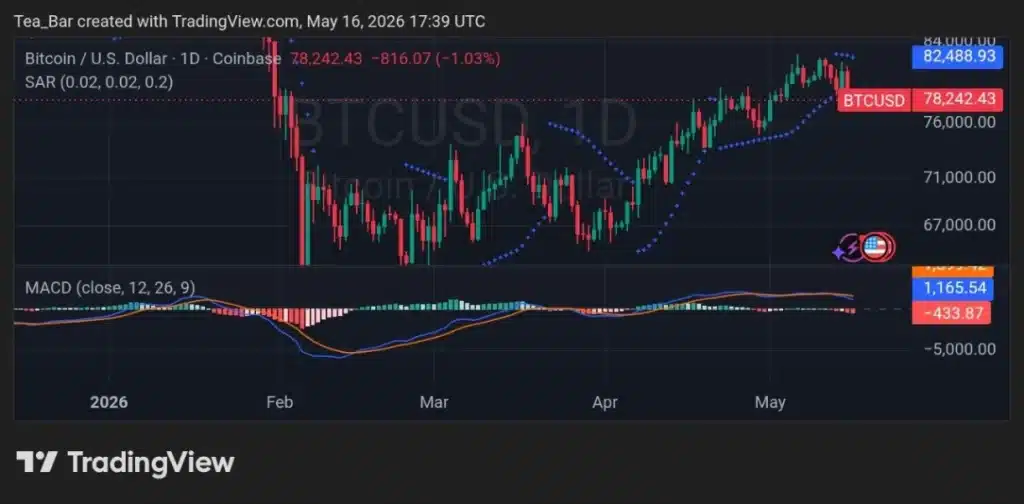
The MACD line at +1,165.54 remains above the signal. The histogram at -433.87 is negative but shrinking.
Price is sitting on the red dashed horizontal — the same level that acted as resistance through the March consolidation and is now being tested as support.
A daily close below this level opens a path toward $76,000. A recovery above $80,000 would negate the bearish SAR signal and put the daily trend back in bullish territory.
Bounce or Breakdown — What Decides It?
The 200-day EMA at $82,228 is the key level for medium-term trend confirmation. A confirmed daily close above it would open $84,766 as the immediate target.
Losing $78,054 risks a pullback to $74,956, with $66,812 as the worst-case floor. ETF flows have proven remarkably resilient since launch — weathering price drops and headline noise alike.
The inflation print triggered the move. The $78,000 level is holding for now. But with the Fed minutes due and producer inflation running hot — is this a brief pause before the next leg higher, or the beginning of a correction that the market hasn’t fully priced in yet?
Disclaimer:
This article is for informational purposes only and does not constitute financial, investment, or trading advice. The views expressed are based on publicly available data, market observations, and the author’s interpretation at the time of writing. Cryptocurrency markets are highly volatile and unpredictable, and past performance or current technical setups do not guarantee future results. Readers should conduct their own research and consult with a qualified financial advisor before making any investment decisions. TechGaged does not accept liability for any losses incurred based on the information presented.
How do you rate this article?
Subscribe to our YouTube channel for crypto market insights and educational videos.


Join our Socials
Briefly, clearly and without noise – get the most important crypto news and market insights first.
Most Read Today
1
This Upgrade Could Send Solana Parabolic
2Strategy Could Become the First Company With 1 Million Bitcoin
3Here’s Where Smart Capital Is Moving Into Right Now
4What Hyperliquid’s Growth Says About the Future of On-Chain Markets
5The Hidden Reason XRP Is Suddenly Outperforming BTC Amid CLARITY Act Breakthrough
Latest


8
Also read
Similar stories you might like.

Altcoins
What Hyperliquid’s Growth Says About the Future of On-Chain Markets
Azeez | 2026-05-16

Altcoins
Bitcoin Holds $80K Ahead of $2.6B Crypto Options Expiry
Ana | 2026-05-15
Bitcoin
Strategy Could Become the First Company With 1 Million Bitcoin
Azeez | 2026-05-15
Altcoins
SIMD-0266 Is Live: Solana May Be Preparing for Massive Transaction Growth
Azeez | 2026-05-13

Altcoins
Bitcoin Rebounds Above $81K As Viral Tokens Sink
Ana | 2026-05-13
Altcoins
XRP Spot ETF Funding Hits 4-Month Peak — Bulls Taking Control?
Azeez | 2026-05-13
Bitcoin
Senate Confirms Pro-Bitcoin Kevin Warsh to Fed — What It Means for the Market
Azeez | 2026-05-13

Altcoins
Bitcoin Price Reacts as U.S. Inflation Reaches Two-Year High
Ana | 2026-05-12

Altcoins
Chainlink’s Address Spike May Not Be Organic — Bot Activity or Real Users?
Azeez | 2026-05-12
Market
Is It a Good Time to Buy Crypto Right Now?
Sead | 2026-05-11